QUALITY MONITORING & CONTROL
A “Unified” Approach for
Continuous
Improvements
QMC SUITE
DYFLO
PROGRAM

MANUAL
“What do you want to solve today?”
QUALITY MONITORING & CONTROL
QMC
DYFLO
PROGRAM
“What do
you want to solve today?”
© 2002 Quality Monitoring & Control
832.515.5464
QMC@QMC.net
www.QMC.net
www.EngineersWebSite.com
This software is provided to you subject to the License Agreement.
By opening the program wrap, you have agreed to and are bound
by the License Agreement.
It is always best to
close any open Window applications or virus utilities before installing any Windows program application. Additionally, system privileges must be
provided for loading components into c:/windows/system
directories.
Any previous version of the QMC PROGRAM SUITE should be
removed. This is done in the Windows
Control Panel, Add/Remove
Programs.
1) Insert the QMC PROGRAM SUITE CD-ROM.
2) In the Windows Start Button on the Microsoft Task Bar, go to Settings, then Control
Panel, then
double-click on Add/Remove Programs and follow the on screen
instructions.
3) Click on the Install button.
4) In the ‘Install Program from Floppy Disk or CD-ROM window’, and click
next.
The Setup program should
start by ‘Copying initialization files.’ If you are a first time user, the Setup may
request to shutdown and restart your computer.
This is a standard Microsoft setup and allows for proper registration. Click OK and allow the system to reboot. Any error during the install process should
be reported to your IS administrator and/or QMC.
The Setup program will
check for sufficient disk space. If there is not enough, Setup will stop the
installation process and advise you to clear space before proceeding.
To start the QMC PROGRAM SUITE, click the Start button
on the Microsoft Task Bar, then Programs, then QMC PROGRAM SUITE.
To have easy access to
the QMC PROGRAM SUITE, create a desktop icon.
Once the desktop icon is created, all you need to do is double-click the
icon.
Computer: 486,
Pentium or better
Memory: 12
MB RAM
Minimum Disk Space: 25 MB
Operating System: Microsoft Windows
Networking: Capabilities
Available
Other Software: Microsoft
Office
Display size Optimized
for 800 x 600 pixels
Display color 256 color required, 32 bit preferred
QMC DYFLO PROGRAM for Windows
TABLE OF CONTENTS
SECTION 1 QMC DYFLO
PROGRAM............................................ 2
QMC
DYFLO Program Overview............................................ 4
Features
and Specifications................................................... 5
SECTION
2 INSTRUCTIONS.......................................................... 7
Steps
for the QMC DYFLO Program...................................... 8
SECTION
3 QMC DYFLO SCREENS........................................... 11
Flowsheet
Setup Screen...................................................... 12
DYFLO
Setup Screen.......................................................... 14
Physical
Properties Screen.................................................. 15
Component
Plots Screen..................................................... 16
Mass
& Energy Balance Screen........................................... 17
Mass
& Energy Plots Screen................................................ 18
Quantities
and Units............................................................ 18
Spreadsheet
Screen............................................................ 19
![]()
QMC DYFLO PROGRAM for Windows
|
W |
elcome to the QMC PROGRAM SUITE with the QMC DYFLO Program. The QMC DYFLO Program is a complete process dynamic simulation originally developed by DuPont.
The DYFLO Program has been utilized since the mid 1960’s with tens of thousands of successful applications.
The combination of these programs, the QMC “unified” approach, provides the most rigorous process dynamic simulation available. We, at QMC, are proud to provide a unique proprietary development for your advanced process simulation analysis. This combination was developed and designed to provide you and your company the most comprehensive and competitive advantage in the process industries.
We look forward to working with you and helping you improve your process.
The QMC Staff
QMC DYFLO Program Overview
What is the QMC DYFLO Program?
The QMC DYFLO Program is a dynamic and steady state physics process simulator based on a time dependent method. This program includes all physical/chemical property calculations with a flow sheet generator interface. Model in a dynamic time domain for tanks, control valves, pumps, heat exchangers, pipes, valves, controllers, distillation, reactors/combustors, compressors/expanders, etc. The QMC DYFLO Program methodology has been successfully used in chemical processes for over 30 years with benefits for system analysis and robust methods for actual operations evaluation.
The QMC DYFLO Program is for engineers to solve systems of simultaneous algebraic and ordinary differential equations. It provides groups of equations pre-programmed to simulate the dynamic and steady state behavior of common chemical process unit operations. It solves algebraic / differential equations and simulates process controls. This process simulator duplicates the behavior of common unit operations and calculates physical properties of process streams.
Applications
● Equipment Design
● Fluid Dynamics
● Particle Dynamics
● Flow Analysis
● Process
Control
● System Analysis
● Automatic Control
● Process Measurement
● Reaction Kinetics
● Optimization
● Vapor Equilibrium
● Modeling
● Numerical Solutions
● Unit Operations
Features and Specifications
Background
The basic principles of mathematical modeling of chemical engineering problems was first published as a textbook by J.Wiley Inc. in 1966, titled, "Mathematical Modeling in Chemical Engineering", by Roger G.E.Franks
Subsequently, use of digital computers were introduced in the chemical industry so the modeling approach was amplified and extended by adopting digital technology to simulate the mathematical models developed for chemical processes. A new text book was then published (supplanting the former book above) that not only described the digital technology for solving the models derived for chemical processes, but also listed the computer programs required for doing so. This book was published by J. Wiley in 1972 titled, "Modeling and Simulation in Chemical Engineering", by Roger G.E. Franks
The original "DYFLO" program was a FORTRAN based system consisting of 30 routines for solving large systems of simultaneous non-linear differential/algebraic equations and simulating the dynamic behavior of common chemical process unit operations. It achieved wide usage in the seventies and eighties amongst industrial engineering professionals and senior/graduate students in universities throughout the world.
During the ensuing period, as the DYFLO program was applied to a large variety of industrial and academic problems. The most important improvement was the adoption of implicit integration for the solution of differential equations. Routines for the simulation of additional chemical unit operations were added as well as useful plotting/printing functions. The DYFLO program library expanded to 100 routines and renamed "DYFLO2".
Steps for the QMC DYFLO Program
In the QMC Program Suite Explorer:
- Left
click once on the icon
 next to “DYFLO,
Dynamic Process Simulator” to open the folder. Two folders appear.
next to “DYFLO,
Dynamic Process Simulator” to open the folder. Two folders appear.
- Left
click once on the icon next to “DynSim Components” to open the
folder. Three programs appear.
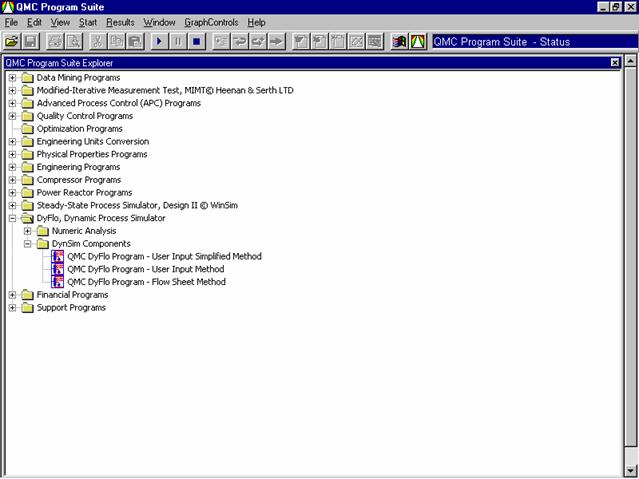
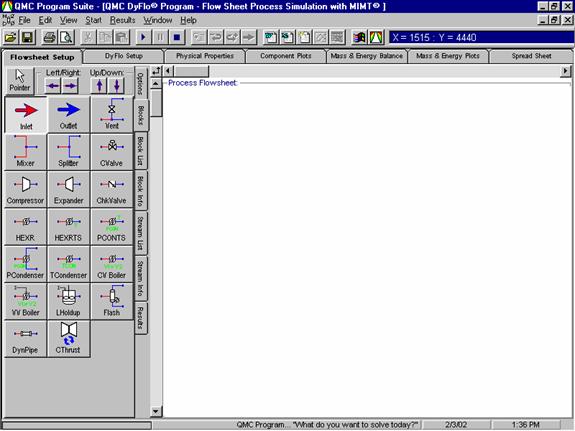
- Left click once on “QMC DYFLO Program - Flow Sheet Method”. In a moment, the following screen appears.
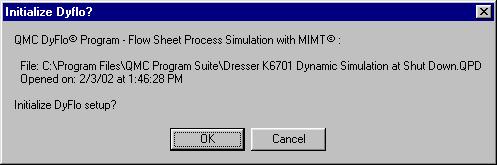
- Open
an existing file in one of two ways.
Go to the top tool bar and select File, select Open or simply click
on the folder open icon
 . For this
exercise, select the Shut Down file, “Dresser K6701 Dynamic Simulation
at Shut Down.QPD”.
. For this
exercise, select the Shut Down file, “Dresser K6701 Dynamic Simulation
at Shut Down.QPD”.
- Data is inserted into the DYFLO Setup screen. Click OK at the following prompt:
Notice the flow sheet being generated and returns the DYFLO Setup screen as follows:
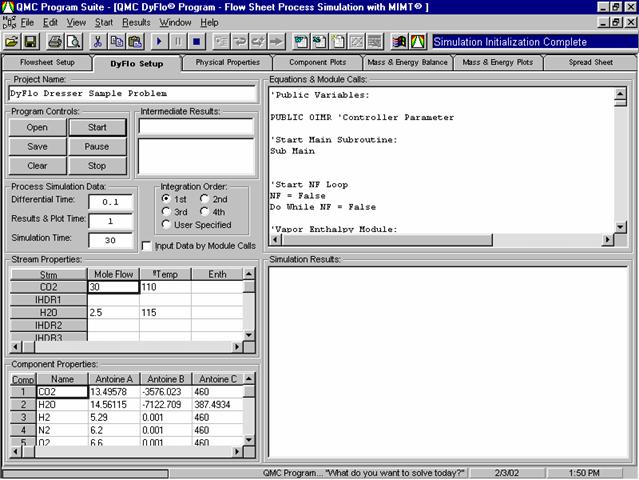
- Upon first run, it is best to change the Simulation Time to 10. Leave all other screen defaults as shown. Simulation Time is found in the Process Simulation Data portion of the screen above.
- Click the Start button. Allow the run to complete the results of the simulation.
Flowsheet Setup Screen
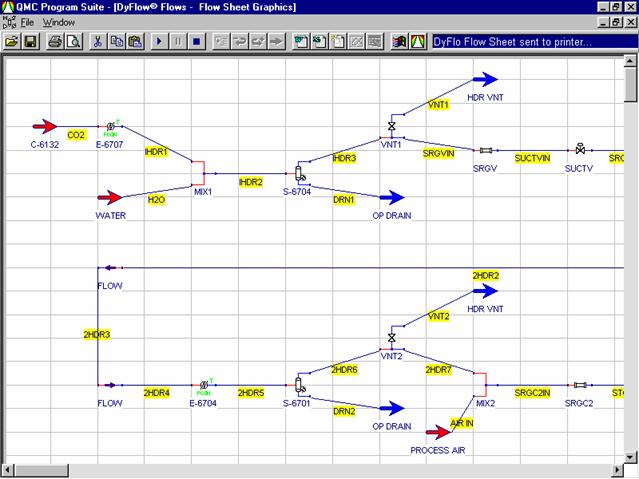
The Flowsheet Setup shows a replication of the process. To see the entire sheet, you will need to print the sheet or copy the sheet into Microsoft Excel.
To print, click the “Print Flow Sheet” button. When your printer menu appears, click on the “Properties” button. Change the orientation features to “Landscape”. Click OK. The Flow Sheet will print onto one page.
If you click “Cancel”, the flow sheet is provided on screen. Scroll bars at the right and on the bottom are utilized to view the entire flow sheet area.
To copy, select from the Flow Sheet screen, Window Menu and select, “Copy”. In the Widows Start Button on the Microsoft Task Bar, go to Start, select Programs, and open Microsoft Excel. Click inside the desired cell and paste.
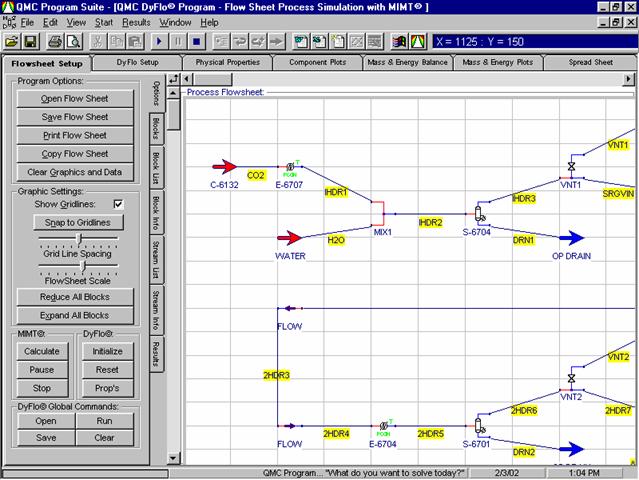
To close the Flow Sheet window, select the File Menu and select Close, or click
the lower of the Close or Exit icon S.
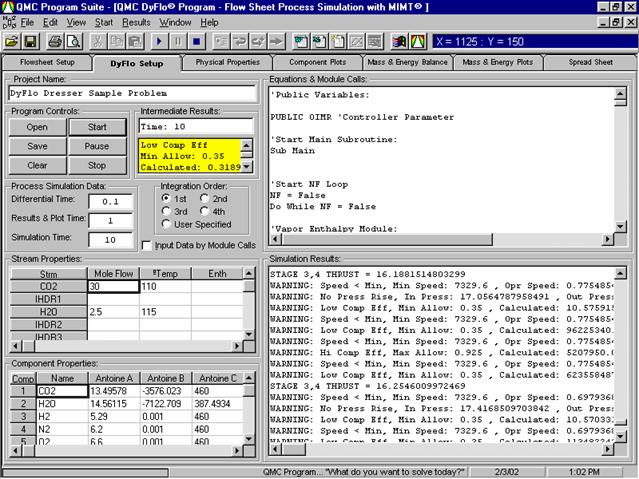
DYFLO Setup Screen
Intermediate Results - The Intermediate Results shows what is going on. Any error messages appear in yellow. Scroll down thru this menu box to give all condition of errors or warnings (with times) of the process, specifically for the compressor.
Simulation Results - The Simulation Results shows compressor thrust results at various times. All error and warning messages are shown. The norm range should be within -100 and 100.
PLEASE NOTE: Contact QMC regarding concerns for values
outside this range.
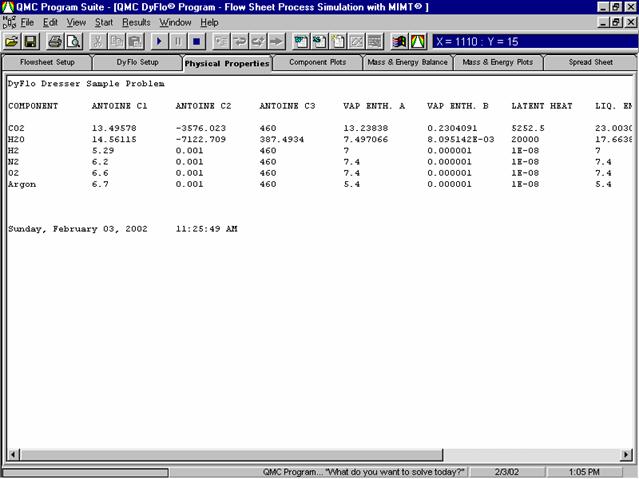
Physical Properties Screen
The Physical Properties Tab gives the vapor pressure and enthalpy constants.
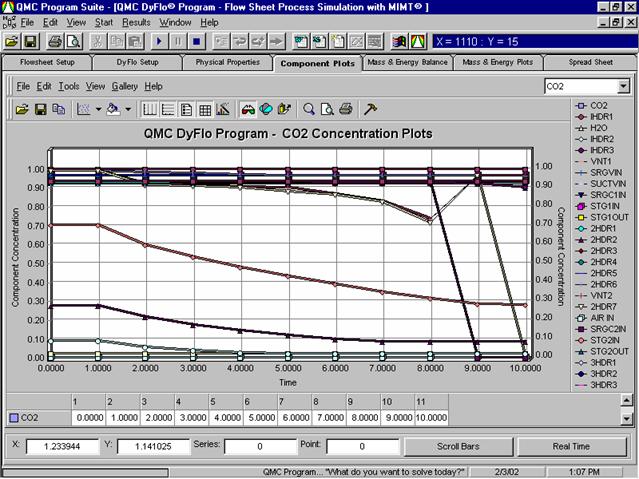
Component Plots Screen
The Component Plots Tab gives concentrations of different components on various process streams.
Pick components.
Select water (H2O) and view new compositions.
ChartFX information follows the Tab reference pages.
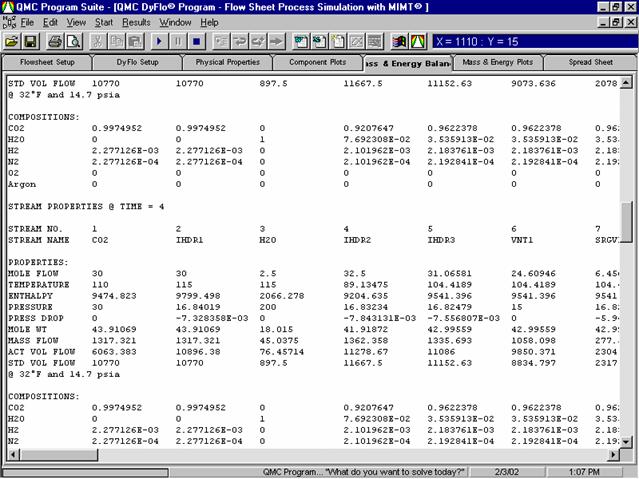
Mass & Energy Balance Screen
The Mass & Energy Balance Tab is used to view compositions or the stream conditions and properties at various times.
Mass & Energy Plots Screen
The Mass & Energy Plots Tab is used to view various stream flows and conditions throughout the process. Select what to plot in the box located in the top right of the screen. This example selection shows Mole Flows. Change selection to Temperature.
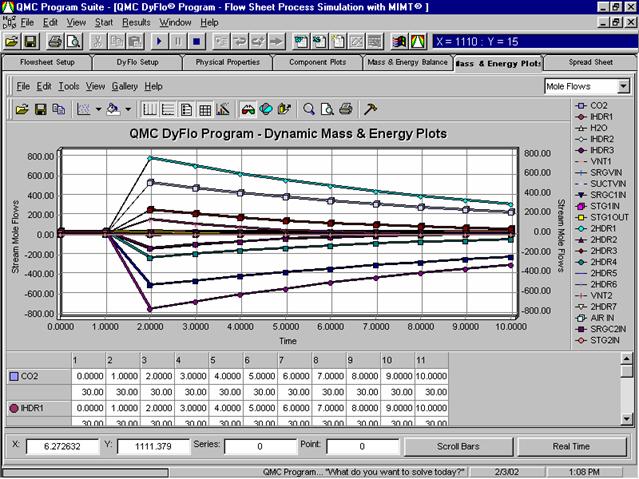
PLEASE NOTE: The standard engineering units are used. Time is in minutes.
Quantities and Units |
|
|
Mole
Flows |
lbmoles/min |
|
Temperatures |
°F |
|
Enthalpys |
btu/min |
|
Pressures |
psia |
|
Pressure
Drops |
psi |
|
Mole
Weights |
lb/lbsmole |
|
Mass
Flows |
lbs/min |
|
Act
Vol Flows |
cuft/min |
|
Std
Vol Flows |
cuft/min @ 32 °F and 1 atm |
|
*
Compositions are in mole fractions |
|
Spreadsheet Screen
The Spreadsheet Tab gives a spreadsheet listing of the data including all compositions and flow conditions versus time.
Example 1
For Example 1, select columns XT and XU by holding down the Control key on your keyboard and selecting each column. Both columns will be highlighted.
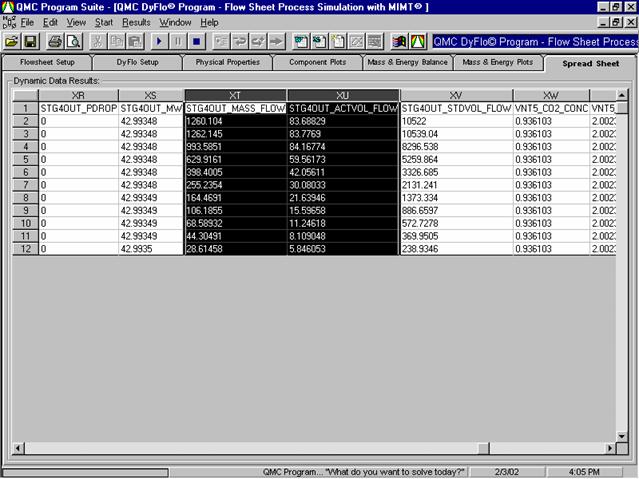
Right click once inside the highlighted area and the following prompt will appear:
When you select Yes, a Data Run Chart shows the contents of the selected columns.
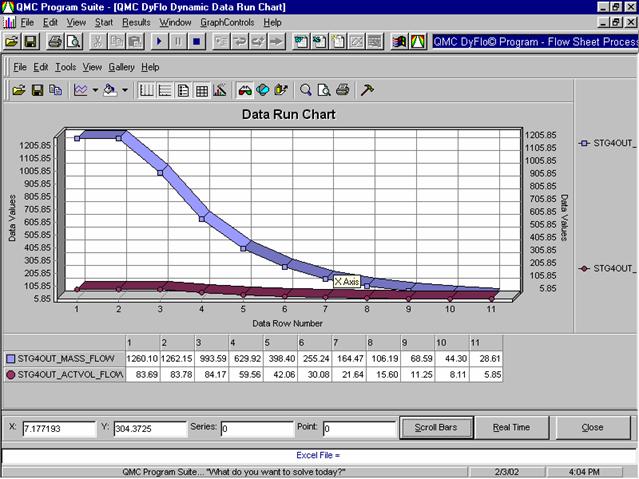
Click the Close button in the lower right hand corner of the screen.
Example 2
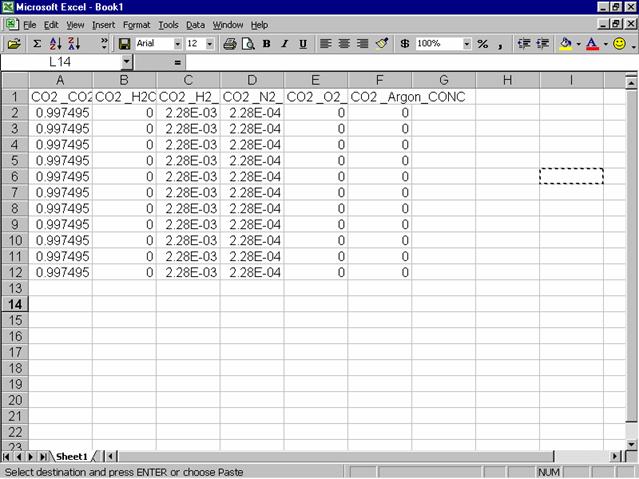
For Example 2, select a range of cells from B1 to G12. Copy the range of cells using CTRL+C. (Press the CTRL key on the keyboard, hold down and, at the same time, press the C key on the keyboard, to copy.)
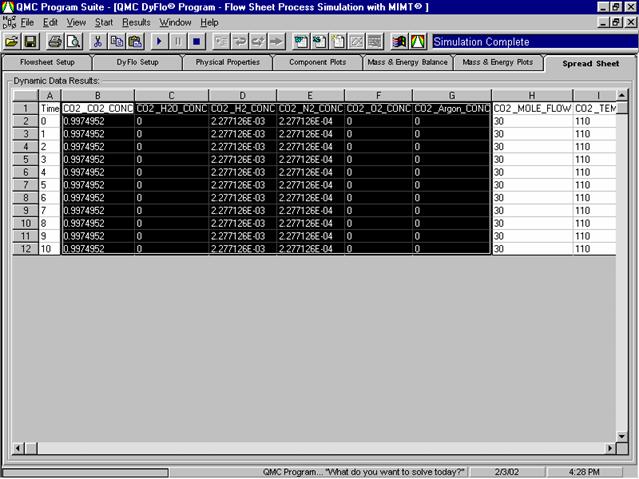
Open Microsoft Excel from the Windows Start Button at the Microsoft Taskbar on the bottom of the screen. After Excel opens, click once in any cell and Paste the range of cells using CTRL+V. (Press the CTRL key on the keyboard, hold down and, at the same time, press the V key on the keyboard, to paste.)
PLEASE
NOTE:
For
any changes of
please
contact qmc.